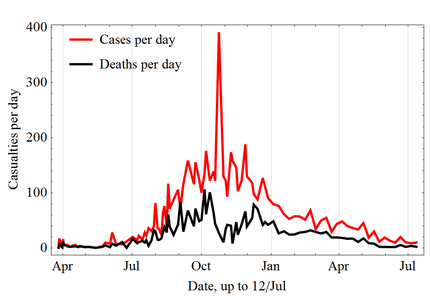
I am beginning to become cautiously optimistic that the increase in cases may have peaked.
I saw the WHO articles this week and wondered what has driven all of that. The updated case numbers arrived today and it's up to the 12th October. Given that these numbers are correct and given that the next few days figures stay the same, then the increase in cases will be roughly parallel with September.
This is pretty significant. In West Africa the cases have been roughly doubling every month. 2,000 ish start August, 4,000 ish start Sept, 8,000 ish start October. Yet by October 12th we had not exceeded 9,000 cases. If the trend had held, we should have been at somewhere over 11,000 cases by October 12th.
As I say, I'm cautious about this. If the current trend holds, we won't exceed 12,000 cases by the end of October. That will be a 4,000 person drop in the expected cases. That has to be good news. We've already seen 2,000 of those cases fail to happen by October 12.
I'm just going to quietly watch the numbers and spend a few minutes hoping that 4,000 more people don't have to go through this hell. If I were that way inclined I'd say a small prayer for them.
It looks like, perhaps not good, but encouraging, news.
Ebola and the statistics
5 posts
• Page 1 of 1
Ebola and the statistics
There are 10 types of people in the world:
Those who understand Binary and those who do not.
Those who understand Binary and those who do not.
-

Suff - Posts: 10900
- Joined: 26 Nov 2012, 09:35
Re: Ebola and the statistics
It is not the statistics that bother me as much as the way they are presented, and by whom. There are departments within the same agency, the WHO, giving out confusing messages. They are only just falling short of contradicting each other.
I mentioned the other day the graph of cases and deaths. The one most used in the media was the linear graph. Do a bit of differentiation on that graph using the 1.5, 2.0 and 2.5 multipliers used by one WHO division and the epidemic becomed unstoppable.
However, there was another, logarithmic, graph where the trend, still upwards, was manageable. It was hardly seen in the media for the simple reason that it was not "graphic" or "frightening" enough.
Last edited by Workingman on 16 Oct 2014, 22:31, edited 2 times in total.
-

Workingman - Posts: 22155
- Joined: 26 Nov 2012, 16:20
Re: Ebola and the statistics
Certainly you won't see them showing this graph....


There are 10 types of people in the world:
Those who understand Binary and those who do not.
Those who understand Binary and those who do not.
-

Suff - Posts: 10900
- Joined: 26 Nov 2012, 09:35
Re: Ebola and the statistics
Latest Daily averages from the last WHO reports in October. Just to be clear, these are the average daily figures between each two WHO reporting dates. The last week has seen a significant drop in the daily rates for both deaths and new cases. The new cases being the most important figures. If the new cases drop, then the spread is slowing.
I had to do it in Excel as Wikipedia has not yet caught up.

It will bounce again as this is a daily trend, but it's not exactly heading for exponential meltdown is it... We are now past the point where we are going to double again in October. I simply don't see it as possible with the level of new cases at the moment. Unless the numbers of new cases increase by a factor of 5, then we won't double.
Which is, guardedly, some good news....
I had to do it in Excel as Wikipedia has not yet caught up.

It will bounce again as this is a daily trend, but it's not exactly heading for exponential meltdown is it... We are now past the point where we are going to double again in October. I simply don't see it as possible with the level of new cases at the moment. Unless the numbers of new cases increase by a factor of 5, then we won't double.
Which is, guardedly, some good news....
There are 10 types of people in the world:
Those who understand Binary and those who do not.
Those who understand Binary and those who do not.
-

Suff - Posts: 10900
- Joined: 26 Nov 2012, 09:35
Re: Ebola and the statistics
I am increasingly confident it will die out this time but the next outbreak? 
- pederito1
5 posts
• Page 1 of 1
Return to News and Current Affairs
Who is online
Users browsing this forum: No registered users and 16 guests
